
In 2015 I posted an article about the potential of HTTP/2 (or “H2”) regarding performance improvements. In that article, I explain a bit about the history of HTTP 1.x and how we got to H2 with an overview of how it works. With the release of LoadRunner 12.53, there is now official support for H2, so I am revisiting this technology with my tester hat on. I was interested in comparing H1 to H2 to observe the effects of browser response times. To do this, I set up my own H2 web site and servers. I want to share with you how I did it and what I found, in case you want to try it out for yourself. This article goes along with this video on my YouTube channel. The video contains more detail about configuration and setup (please subscribe).
Setting Things Up
The first thing was to set up two separate web servers in the cloud on the same network segment that were identical (or as close as possible) with the same system specifications. I chose Ubuntu 14.04 as the OS and NGINX 1.10 as the web server. I checked the site on a hard-wired network connection on an ISP with speeds of 90 Mb down and 12 Mb up. I configured “Server H1” to use HTTP 1.1 and “Server H2” to use HTTP 2.0 over HTTPS. I generated my own certificate and key to get SSL/TSL functionality. On Server H2, I also added a custom log file that would show me the SSL/TSL connection type and version along with the specific cipher used.
I used the following web site articles to get things set up on the server side:
- Upgrade Nginx to the latest version
- Setting up server blocks within NGINX
- Enable SSL with a Self-Generated Certificate
- Configuration file setting in NGINX to enable HTTP2
- Create a custom log to report on HTTP2 traffic
These sites made it really easy to get up and running fast. And…then it broke!
Chrome 51 Removes NPN
When you start dealing with H2, you must use a secure connection. It’s possible to run H2 without it, but no major vendor (i.e. Microsoft, Mozilla, or Google) is going to support it. H2 without any security is known as “H2C” – or HTTP/2 in-the-clear. Github is tracking H2 web servers and denotes which ones offer H2C options. But, I digress.
With secure connections, things tend to get a bit hairy quickly. As mentioned above, we had to generate a certificate, change configuration settings, and verify that the ciphers worked. It looked like everything was working as designed. In the midst of testing, Google released Chrome 51 and the browser on my test machine was updated at the end of testing the H1 server. The following day, I browsed the H2 web page in Chrome and saw nothing but HTTP 1.1 traffic over SSL! Since I knew nothing had changed on the web server, I researched the Chrome update. Sure enough, a big change had occurred. Google decided to remove support for NPN negotiation (leftover from SPDY), which left only ALPN negotiation. I had assumed my web pages were using ALPN because the Google Chrome developer tools told me the traffic was H2.
When NPN was removed from the browser, my connection dropped back to HTTP 1.1. That’s when I realized the secure layer was controlled by OpenSSL and it would need to be updated to fully support this. Had I chosen Ubuntu 16.04 instead of 14.04, this would not have been caught. After many curse words were spoken by my web server administrator, OpenSSL was updated on Ubuntu 14.04 and everything started working again. NGINX has come out and addressed this issue, so hopefully others won’t experience this same problem.
HTML Web Page Demo
My web site was a simple HTML page that had a table of 15 columns and 20 rows of small PNG files. Each image file was a different size that varied from 1k to 8k but the total sum of all 304 requests (the images and other HTML resources) added up to about 500Kb.
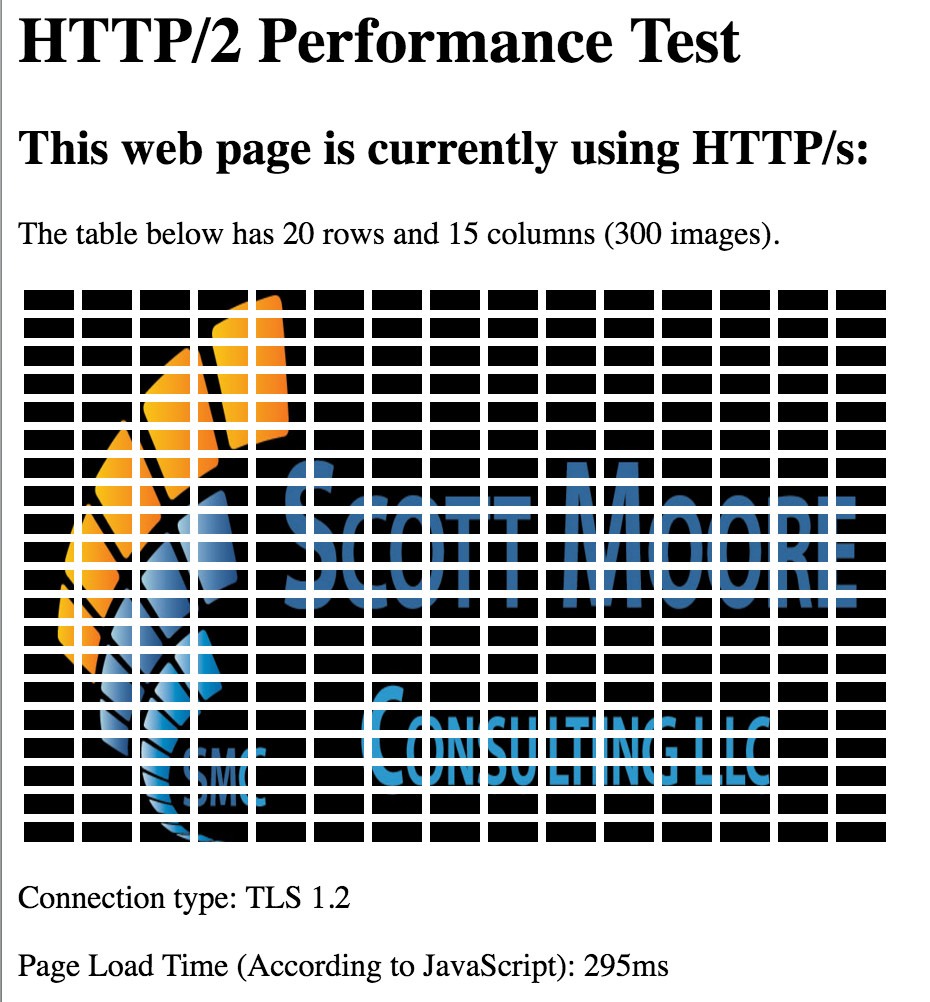
I created an additional HTML file called “index_debug” which would show me the total page load time at the bottom of the page just so I could see the difference with out using any additional tool.
The JavaScript code was :
window.onload = function(){

setTimeout(function(){

var t = performance.timing,

pTime = t.loadEventEnd - t.responseEnd;

var stats = document.createElement('p');

stats.textContent = 'Page Load Time (According to JavaScript): ' + pTime + 'ms';

document.body.appendChild(stats);

console.log(t.loadEventEnd - t.responseEnd);

}, 0);

}
If you would like to get more information about why I chose that specific timing formula, check out the performance.timging object in the JavaScript API or check out this online article at HTML5Rocks.com for more information.
I removed this JavaScript in the index.html for the actual load test and only used it for debugging purposes.
HTTP/2 Behavior
Using the Chrome developer tools, I could easily show when the HTTP/2 protocol was being used and when it was not. By showing the Network tool, I could easily see “H2” was the protocol. While both made 304 requests, H2 only used a single TCP connection versus six for H1. H2 completed the page in about 2 seconds for the first request and even faster for the second request when caching kicked in. Here is first and second requests with H1:
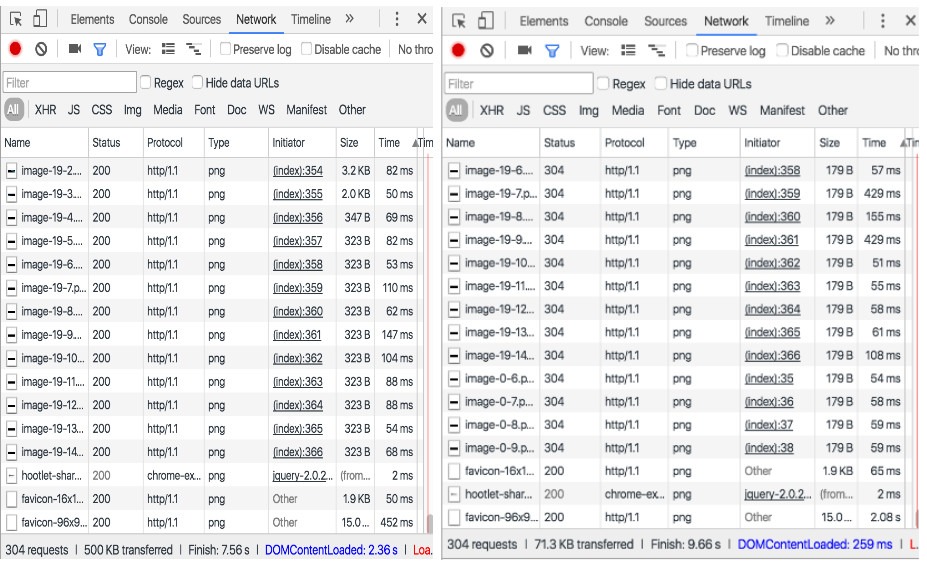
And here is the comparison on H2:
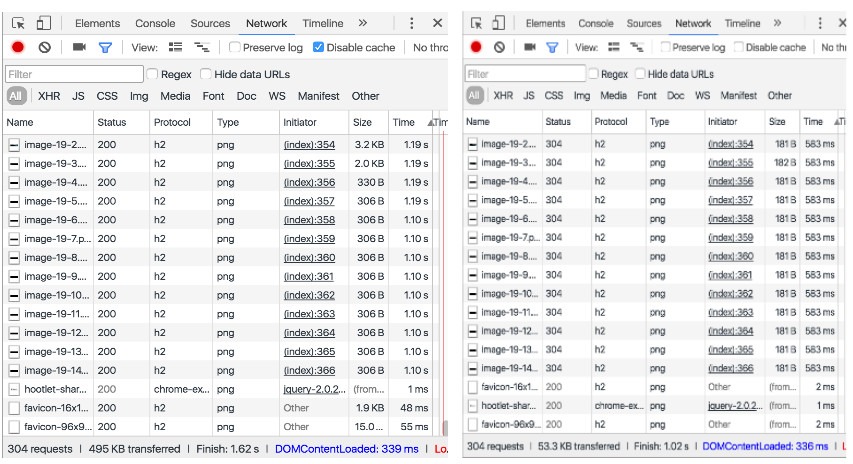
As you can see from the images above, upon the second request (on both servers) the images were already cached but the load times are much different. For H1, 71Kb was pulled down, and for H2 only about 53Kb was pulled down. This told me that the header compression for H2 was working, and saving me even more time and round trips. The speed of H1 did not really improve for the second request even though only the header information was pulled. Why? Because those 300 requests were using 6 connections and connections are the expensive part to H1. All of those trips back and forth were text-based with full headers for each one. The difference in the request time could be explained with a slight change in network conditions or server load between requests. But it makes a pretty big deal to the end user who is waiting 9 seconds to get their graphically oriented page to render. With H2, you have one, fast, binary connection. This is where H2 starts to show its value.
Server Push and Prioritization
Unfortunately, at the time of this article I was unable to test server push or resource prioritization. H2 is so new that most of the major web servers have not implemented it yet. Therefore, I don’t have a way to test it. As it becomes available, I will test it and let you know what I find.
Prioritization isn’t something you see a lot of information about, but here is one article I have found that demonstrates faster load times of .JS and .CSS files when it is used.
LoadRunner Specific Information
LoadRunner version 12.53 and higher supports ALPN connections over HTTP/2, and this is what I really want to see. I had some issues with Vugen not recording and then not playing back, hanging, etc and I found a few significant things you will want to know before trying to use Vugen with H2.
There is now a patch for LR 12.53 (because of my findings) that fixes an issue with NGINX timing out if there are too many multiplexed streams. I would highly recommend you contact HPE Support to obtain this patch. If you are not under a support and maintenance contract, it should roll up to the next service pack or edition of the product and you can get it then.
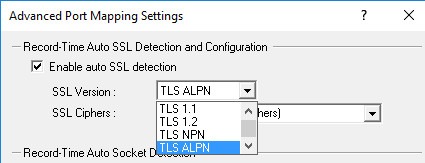
Make sure to set the appropriate recording option in the Vugen recording options for Mapping and Filtering (Advanced Port Mapping). Note that NPN is still there for SPDY, but will most likely be removed in the next version.
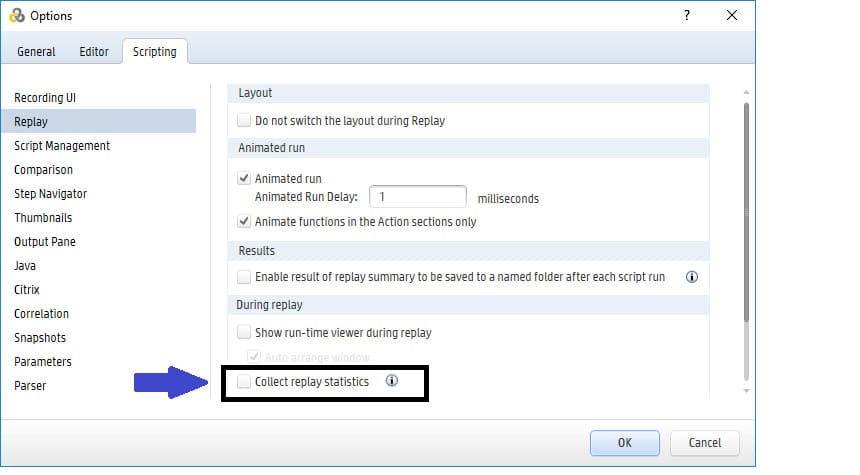
In Vugen, turn off “Collect Replay Statistics”. This is currently not supported for H2. If you do not turn it off, Vugen will hang at the last step. This is because there are additional headers in the H2 protocol and HP has not updated that portion of Vugen that analyzes them.
When you run a test in the Controller, disable Web Diagnostics. This is for the same reason as #2 above. If you don’t, the Vuser collecting the web diagnostic information will hang at the end of the test.
For more information on using LoadRunner with HTTP/2, check out this article on the HPE Community Forums blogs.
Load Test Results
For the load test, I modified the default run-time settings in LoadRunner so that browser caching would be turned off so that I could see the worst case of pulling down all the graphics every time the page was requested of the web server. Since I did not max out my network connection on either side, I never really saw a flat line and performance stayed pretty even. I ran this over the Internet on a shared virtual machine with various real-world chaotic conditions and server load.
This was a pretty simple test of ramping up to ten (10) virtual users over 5 minutes, holding that load for 5 minutes, and then quickly ramping down. Although this testing isn’t in a controlled lab and does not represent what we would do on a real application, we can see patterns emerging and realize H1 is just much slower than H2 at image heavy web sites and it will only get worse at scale.
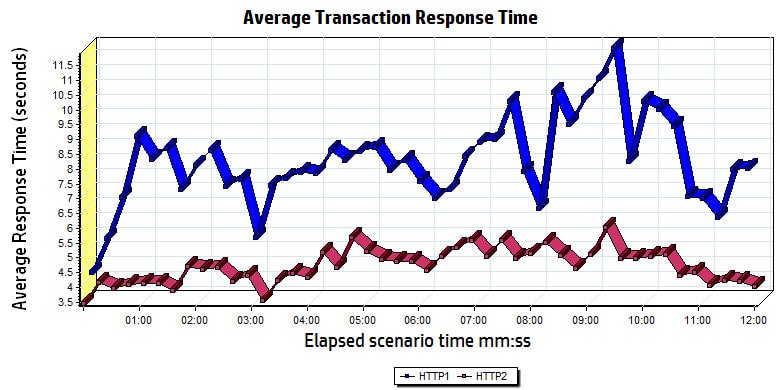
Here is the performance timings of the page from the end users perspective (H2 is the red line):
This is another pretty dramatic graph that shows how H2 conserves connections (H2 is the yellow line):
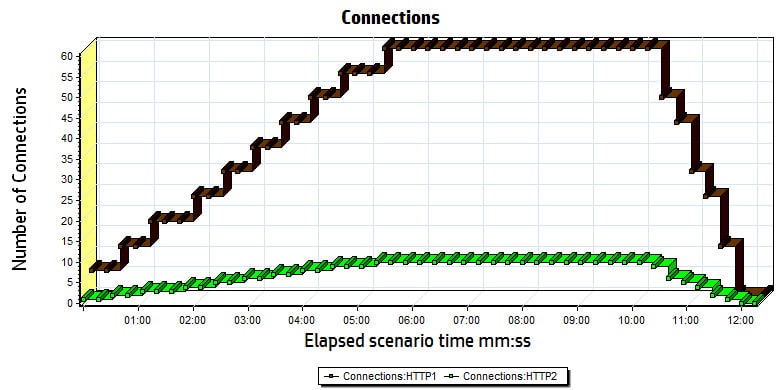
As you can see, we have a lot fewer connections on the H2 server. If you would like to get the complete Analysis LRA session files, just follow me on Twitter and send me a private message and I will send you a download link. That way, you can sort through some of the additional information available that I wasn’t able to share here.
Summary
From this experiment, it appears that H2 is living up to the initial promises. We have a faster protocol that is secure by default. I don’t see what there is to dislike from a performance engineer perspective. Because it handles connections and requests differently than H1, tuning the performance on the front end of H2 web applications will be different than tuning an H1 site. Some of the best practices for H1 will actually hurt the performance for H2. This YouTube presentation from Ilya Grigorik explains in more detail what kinds of things to look for and modify in your best practices as to move your web sites over to H2.
I’d like to mention special thanks to Gennady Gorenshtein at HPE R&D for working with me to correct my issues and provide a patch for Vugen. Special thanks to Petar Puskarich for offering the web servers to test this out. Thanks to anyone else who I may have forgotten that helped me get this article done.
Throughout the rest of 2016 and into 2017, I will be speaking at various conferences about performance testing HTTP/2 applications and how the tuning of the front end is different than HTTP 1.1, and as I discover more ways to test it, I will let you know. Hope to see you out on the road soon. As always, your feedback and input is welcome and encouraged.